VisualBasicでのリアルタイムグラフ描画の基礎の基礎
2015/10/25
VisualBasicで測定データのリアルタイムグラフ描画なんかをするときには、PictureBoxを作成し、そこにBitmapをつくって貼るのだそうです。現状詳しいことはよく理解できてない…。宿題は多いものの、とりあえず
http://social.msdn.microsoft.com/Forums/ja-JP/vbgeneralja/thread/9921d2bf-6e1f-4b16-be5e-4353e0cae889/
このページを参考に。とりあえず宣言部分。
Public Class Form1
Private g As Graphics
Private x() As Integer
Private y As Integer
Private old_y As Integer
Private RED_Pen As New Pen(Color.Red, 1)
Private j As Integer = –180
Private Random As New System.Random
Private g As Graphics
Private x() As Integer
Private y As Integer
Private old_y As Integer
Private RED_Pen As New Pen(Color.Red, 1)
Private j As Integer = –180
Private Random As New System.Random
とにかくここは初心者なので、ページの通りまずは作成。
どうやらこのプログラムは、PictureBoxの中心に座標の(0,0)をとれるように工夫してあるんですね。とりあえず今それは必須でないものの…
Private Sub Form1_Load(ByVal sender As System.Object, ByVal e As System.EventArgs) Handles MyBase.Load
PictureBox1.Image = New Bitmap(PictureBox1.Width, PictureBox1.Height)
g = Graphics.FromImage(PictureBox1.Image)
g.Clear(Color.White)
g.TranslateTransform(PictureBox1.Width \ 2, PictureBox1.Height \ 2)
g.ScaleTransform(1, –1)
old_y = 0
End Sub
PictureBox1.Image = New Bitmap(PictureBox1.Width, PictureBox1.Height)
g = Graphics.FromImage(PictureBox1.Image)
g.Clear(Color.White)
g.TranslateTransform(PictureBox1.Width \ 2, PictureBox1.Height \ 2)
g.ScaleTransform(1, –1)
old_y = 0
End Sub
そのまま書きました。いつか参考に。
ボタンを2つ作って、以下のように記述。
Private Sub Button2_Click(ByVal sender As System.Object, ByVal e As System.EventArgs) Handles Button2.Click
g.DrawLine(Pens.Red, 0, 0, –100, –100)
PictureBox1.Refresh()
End Sub
Private Sub Button1_Click(sender As System.Object, e As System.EventArgs) Handles Button1.Click
g.DrawLine(Pens.Blue, 0, 0, 100, 100)
PictureBox1.Refresh()
End Sub
g.DrawLine(Pens.Red, 0, 0, –100, –100)
PictureBox1.Refresh()
End Sub
Private Sub Button1_Click(sender As System.Object, e As System.EventArgs) Handles Button1.Click
g.DrawLine(Pens.Blue, 0, 0, 100, 100)
PictureBox1.Refresh()
End Sub
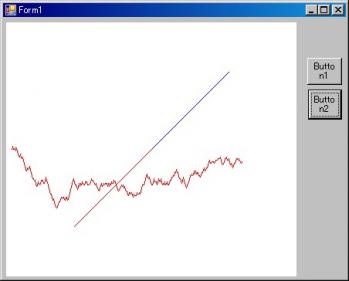
つまり、Button1を押したときには真ん中から右上に青い線を。Button2なら真ん中から左下に赤い線を引く…という。この部分が、図に線を引くときの第一歩的入門部分であり…。
そこに、ワンスパイス追加。
Private Sub Timer1_Tick(sender As System.Object, e As System.EventArgs) Handles Timer1.Tick
y = old_y – 5.5 + System.Math.Floor(Random.NextDouble() * 10 + 1)
g.DrawLine(RED_Pen, j – 1, old_y, j, y)
PictureBox1.Refresh()
j = j + 1
old_y = y
End Sub
End Class
y = old_y – 5.5 + System.Math.Floor(Random.NextDouble() * 10 + 1)
g.DrawLine(RED_Pen, j – 1, old_y, j, y)
PictureBox1.Refresh()
j = j + 1
old_y = y
End Sub
End Class
宣言しておいたRandomとTimerを用いまして、疑似リアルタイムグラフ描画(予行演習的な。)
実行すると…。
左側から酔歩のグラフ。

・落し物・
サンプルプログラム:Graph_p01.zip←右クリック+対象をファイルに保存
サンプルソース一式:Graph_p01s.zip←右クリック+対象をファイルに保存
